TIMER PIL Profiling - PIL Timing Profiler


Overview
The MCHP_TIMER_PIL_Profiling block enables precise code execution timing measurement during Processor-in-the-Loop (PIL) simulations. It uses hardware timers to measure actual execution time of Simulink subsystems or blocks on target hardware.
This block is essential for performance profiling, real-time constraint verification, and optimization of embedded code. It provides microsecond-level timing accuracy using the target’s hardware timer peripheral.
When to use:
- PIL testing — Measure actual execution time on target hardware during PIL simulation
- Performance profiling — Identify slow subsystems or optimization targets
- Real-time verification — Confirm code meets timing deadlines before deployment
- Code optimization — Benchmark different algorithm implementations on target
- Worst-case timing — Measure maximum execution time for safety-critical systems
When NOT to use:
- Normal simulation — Block only active during PIL, not in standard Simulink simulation
- External Mode — External Mode provides signal monitoring (use profiling for timing only)
- Code generation only — If not running PIL tests, profiling block not needed
- Instrumentation overhead — Timer reads add overhead to measured code (small but present)
- Already optimized — If timing constraints easily met, profiling not necessary
Block Dialog
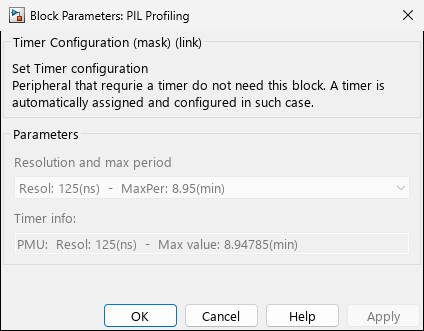
Screenshots taken with chip 33AK512MPS512
Ports
Inputs: None (profiling markers inserted automatically)
Outputs:
ExecutionTime- Measured execution time in selected unitsOverflowFlag- Indicates timer overflow (measurement invalid)
Parameters
Timer Resource Selection
| Parameter | Variable | Description | Options |
|---|---|---|---|
| Timer Ressources | TIMER_Ressource | Hardware timer allocation constraint | No constraints Preferred, Timer 1-9, Pick one from user list |
| Timer List | TIMER_Ressource_Custom | Custom timer list (when using custom selection) | Array, e.g., [1 2 3] |
Timer Resolution
| Parameter | Variable | Description | Display Format |
|---|---|---|---|
| Resolution and max period | TIMER_Resolution | Timer prescaler selection for profiling accuracy | “Resol: X(µs) - MaxPer: Y(s)” |
Note: The timer resolution dropdown shows available prescaler options with their corresponding resolution and maximum measurement period. Lower resolution provides longer maximum periods but less precise measurements.
Timer Information
| Parameter | Variable | Description |
|---|---|---|
| Timer info | Info | Read-only display showing allocated hardware timer |
Device Support
| Family | Timer Used | Resolution |
|---|---|---|
| dsPIC30/33F/33E/33C/33A | Timer1 (typically) | Instruction cycle |
| PIC32 | Core Timer (CP0) | CPU cycle |
| SAMx (ARM) | SysTick or TC | CPU cycle |
Examples
Example 1: Measure Subsystem Execution Time
1. Place MCHP_TIMER_PIL_Profiling block in model
2. Configure for Start/Stop mode
3. Build and run PIL simulation
4. Monitor ExecutionTime output signal
Example 2: Verify Real-Time Constraints
% MATLAB verification script
maxAllowedTime = 100; % microseconds
if ExecutionTime > maxAllowedTime
    warning('Real-time constraint violated!');
end
Implementation Details
Profiling Mechanism
- Start Marker: Captures timer value before code execution
- Code Execution: Target code runs normally
- Stop Marker: Captures timer value after execution
- Calculation: Elapsed time = (Stop - Start) / Timer Frequency
Timer Resolution by Family
- dsPIC @ 60MHz Fcy: 16.67ns per tick (1:1 prescaler)
- PIC32 @ 200MHz: 5ns per CPU cycle
- SAMx7 @ 300MHz: 3.33ns per CPU cycle
Related Blocks
- MCHP_TIMER_Config - Timer resource configuration
- PIL Testing - PIL testing workflow
- External Mode - External mode debugging